In one line: Draw the variables in a situation and the arrows of cause and effect between them. The closed loops that appear explain why the system behaves as it does.
Core idea
A causal loop diagram is a quick sketch of a system’s feedback structure. Each arrow says a change here causes a change there, marked with a sign: + (same direction) or − (opposite direction). When arrows close into a loop, the loop is either reinforcing (R), amplifying change, or balancing (B), resisting it. It is the main drawing tool for applying Thinking in Systems.
How it works
- Pick a seemingly complicated situation and state the behavior that puzzles you, ideally as a trend over time.
- List the variables that affect it. Use nouns that can rise or fall: workload, quality, rework, morale.
- Classify them:
- stocks: accumulations, such as backlog or skill
- flows: rates that change them, such as new requests or training
- valves: what controls the flows, such as hiring policy or review capacity
- Draw the arrows with their signs, and mark important delays.
- Find the loops and label each R or B.
- Tell the story of each loop in a sentence, then ask which loop dominates now, and where to intervene (see Leverage Points).
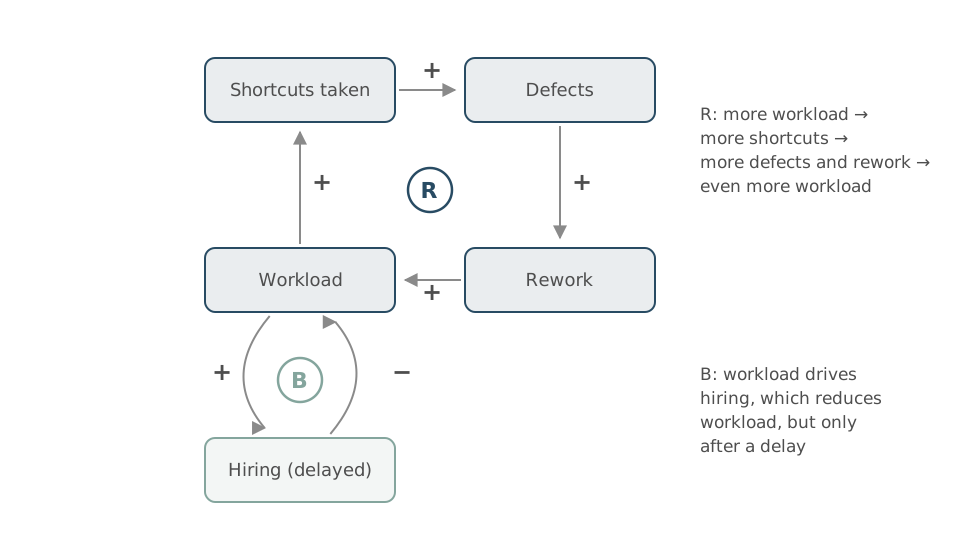
A reinforcing loop (workload, shortcuts, defects, rework, more workload) fighting a slower balancing loop (workload drives hiring, which eventually reduces workload).
In practice
Even a hand-drawn diagram of a home or work situation, such as a commute, a team’s backlog, or a household budget, usually reveals one loop people hadn’t noticed. Drawing it with the people involved is the real value: disagreements about the arrows are disagreements about how the system works, and they are much better aired on paper than in meetings.
Questions to ask yourself
- What is the reinforcing loop behind the problem that keeps getting worse?
- What balancing loop is supposed to stop it, and why is it too slow?
- Which variable in my diagram is a stock that takes a long time to change?
Connections
- Theory: Thinking in Systems. Patterns to look for: System Traps. What to change: Leverage Points.
- Related views: Iceberg Model, Functional Flow Block Diagram.
- Capabilities exercised: Inquiry, Communicating and Advocacy, Connecting Across Disciplines.