In one line: A radar chart with one spoke for each of the fourteen Engineering Leadership Capabilities. You rate yourself from 0 to 10 on each, join the points, and the resulting shape becomes the program’s main tool for self-assessment, feedback and growth.
Core idea
The spider chart turns the fourteen capabilities from a list into a picture. Each capability is a spoke radiating from the center; the center is 0 and the outer ring is 10. Plot a rating on every spoke, connect the dots, and you get a polygon that shows at a glance where you are strong, where you are thin, and how balanced you are overall.
The program uses the same chart at three points, which is what makes it powerful:
- Baseline, at the start (fall). A quick, gut-feel self-assessment before any coursework. It becomes the reference everything else is compared against.
- In the round, near the end (spring). The same chart, completed by you, your manager, and a peer, ideally one from your sponsoring organization (see 360-Degree Assessment).
- On other people (spring). In the leadership-stories exercise, you rate a researched leader on the same fourteen spokes and justify each rating with evidence from their life (see Studying a Leader).
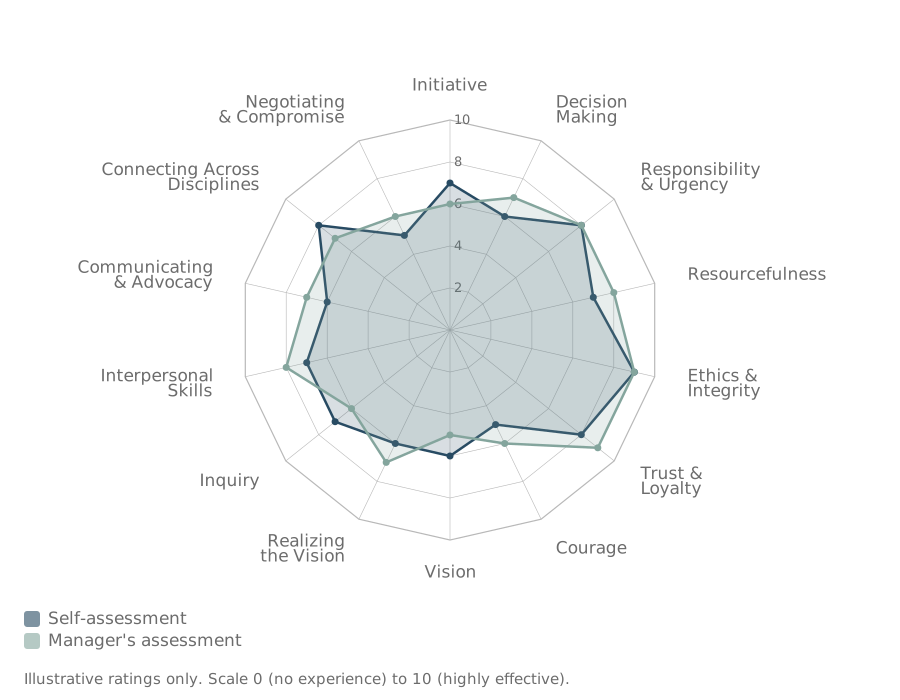 Illustrative example, with invented ratings, comparing a self-assessment with a manager’s assessment. The gaps matter more than either shape: here, the manager sees more Resourcefulness, Interpersonal Skills and Courage than the person credits themselves with, but less Initiative and Connecting Across Disciplines.
How it works
Building the chart
- Rate quickly, by gut feel. Overthinking pulls every score toward the middle. A 10 means extensive, comfortable, effective experience; a 0 means no experience, or the capability isn’t yet understood.
- Rate behavior, not intent. Score what you actually do, not what you value.
- Plot and connect. Use the blank template, or any radar-chart tool, and keep the axis order fixed so charts can be overlaid.
- Put your name and the date on it. It is a snapshot, and you will want to compare snapshots later.
Reading the chart
| What you see | What it usually means | What to do |
|---|---|---|
| A lopsided shape | Strength concentrated in one cluster, e.g. drive but not relationships | Pick one low spoke next to a high one; strengths can lift neighbors |
| A small, even shape | Early career, or modest self-rating | Ask others to rate you before concluding |
| A large, even shape | Experience, or optimism | Test against a 360; look for examples behind each high score |
| One deep notch | A specific gap that will show under pressure | Make it a development goal with a concrete behavior |
| Self above others on a spoke | A possible blind spot | Ask for specific examples |
| Others above self on a spoke | An undervalued strength | Use it more deliberately |
Using it to grow
- Choose one or two spokes to develop, not all fourteen.
- Tie each to an observable behavior (for example, ask two questions before giving my view in design reviews for Inquiry).
- Recruit evidence: a mentor, a project, a stretch assignment.
- Re-plot at the next milestone and compare shapes.
In practice
The first chart is often surprising in its shape more than its scores. Many engineers find their highest spokes in the “drive” and “character” clusters (getting things done, integrity, responsibility) and their lowest in relationships and vision, which tracks the usual path from technical contributor to leader. The 360 version is where the real learning happens. Raters explain why they scored as they did, and those explanations contain the specific feedback that annual reviews rarely give. Using the same chart on a historical leader closes the loop: it trains you to see each capability as concrete behavior you can recognize, in others and then in yourself.
Questions to ask yourself
- Which spoke would I most like to be two points higher in a year, and what behavior would get it there?
- Where do I expect my manager’s chart to differ from mine, and why?
- Which of my high scores could I back with a specific, recent example?
Connections
- The framework it plots: Engineering Leadership Capabilities.
- The 360 version: 360-Degree Assessment. Uses with: Personal SWOT, Strengths-Based Development.
- Applied to others: Studying a Leader.
Sources
- Program assessment tool, used with the program’s blank chart template and capability definitions; no public source.