In one line: The Smith chart maps every possible impedance onto a single circle, so the behavior of transmission lines and matching networks becomes geometry. Moving along a line is a rotation, and matching means steering toward the center.
Core idea
At radio and microwave frequencies, the wires connecting parts are a significant fraction of a wavelength long. A mismatch between a line and its load reflects part of the signal back toward the source. The reflection coefficient measures the mismatch:
- is the load impedance and the line’s characteristic impedance, commonly 50 Ω.
- is the load impedance normalized to .
Every passive load has . Phillip H. Smith’s insight [1] was to draw the grid of normalized resistance and reactance on the plane of . All impedances, from a short circuit to an open circuit, then fit inside one circle, and the hard calculations become graphical.
How it works
Reading the chart:
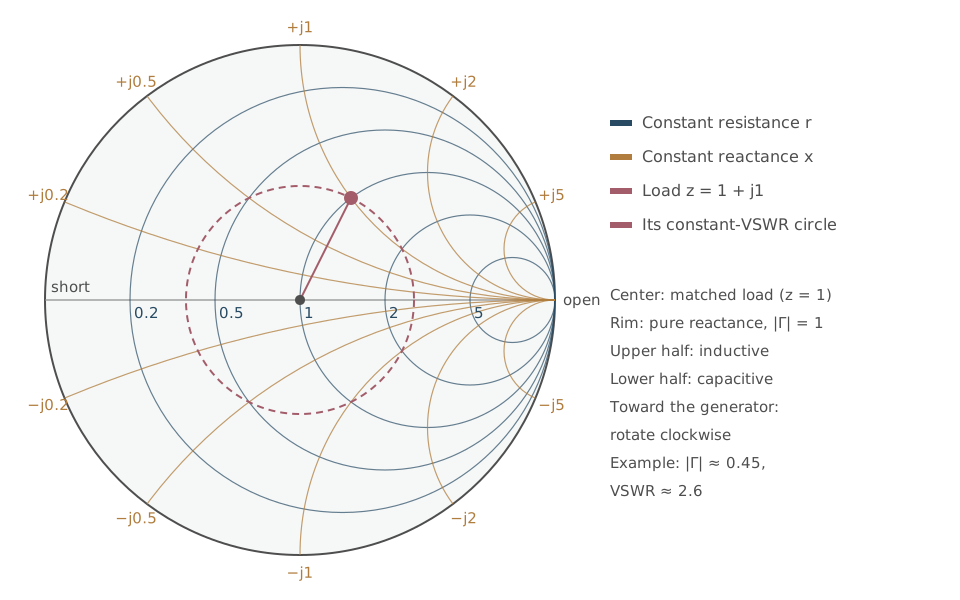
- The center is a perfect match (, ).
- The rim is pure reactance, where everything reflects (). The far left point is a short circuit and the far right an open circuit.
- Circles tangent at the right-hand point are constant resistance. Arcs from that point are constant reactance: inductive in the upper half, capacitive in the lower.
Moving along a lossless line keeps constant, so the impedance travels around a circle centered on the chart. Moving toward the generator turns it clockwise, and a full turn is half a wavelength. A lossy line spirals inward.
Standing waves. The voltage standing wave ratio follows from the reflection’s magnitude:
Example: gives , so . That means a VSWR of about 2.6 and a return loss of about 7 dB. Roughly 20% of the incident power is reflected.
Matching. Adding a series or shunt reactance moves the point along a resistance or conductance circle. Matching networks are paths that steer the load to the center. They include:
- single or double stubs: short lengths of line
- lumped L-networks of an inductor and a capacitor
- quarter-wave transformers
Flipping the chart 180° turns it into an admittance chart, which makes shunt elements easy to handle.
In practice
Hand plotting has given way to software, but the chart survives as the standard display. Every network analyzer and RF simulator shows impedance on a Smith chart, because the geometry shows at a glance how far from matched a design is, across a whole band of frequencies. For a non-RF leader, it is worth knowing what the plot means: the closer a trace hugs the center, the better the match and the less power is wasted or bounced back into the transmitter.
Questions to ask the experts
- What return loss or VSWR does the specification require, and across what band?
- How sensitive is the match to component tolerances and temperature?
- Where does the trace come closest to the rim, and why?
Connections
- Its inventor, and a leadership study: Phillip H. Smith.
- The discipline: Electrical and Computer Engineering. Lumped elements and resonance: RLC Circuits. Systematic circuit methods: Nodal Analysis.
- Capabilities exercised: Inquiry, Resourcefulness, Communicating and Advocacy.